This is the place to find –
- New ‘stuff’ before it’s added into main text. (when time allows)
- Current ‘news’ (filtered to remove ‘Alternative facts’ & ‘Fake news’)
Sadly ‘Alternative facts’ & ‘Fake news’ are not just found in politics and media, disappointingly they are also in science too. Please read – A rough guide to spotting bad science.
|
Stop Press will be updated monthly (ish) (so please bookmark).
♦ ♦ ♦ ♦ ♦
Is CO2 the greatest threat to the earth ?
Here’s A simple, low cost scientific way to prove to yourself whether the CO2 Global Warming theory is correct … or not –
From the Catastrophic Anthropogenic Global Warming (CAGW) playlist we constantly get –
- “The world is in fire”,
- “Man made CO2 is cooking us”,
- “CO2 is the most powerful greenhouse gas”
All the catastrophic doom laden (species annihilation, 20′ sea level rise, crop failures…) story’s that we hear every day, stem from that CAGW theory … so it’s important to know if its true.
The basis of the theory is that CO2 in the atmosphere forms an invisible blanket around the earth that reflects Infra Red back to earth (& yes, it does a little ), re-heating the surface, thus raising the temperature, leading to a climate change.
SO, lets see how much Infra Red is actually reflected back.
For the experiment you need –
1. – An Infra Red Digital Thermometer
(~$/£10 on eBay… Very useful in the kitchen when you’ve finished ! )
2. – & Pen & paper.
The only bit of physics you need to know is –
(from the second law of thermodynamics)
Heat always flows from hot to cold; therefore –
“cold objects CAN’T heat warmer objects”
If you don’t believe that…Try boiling a kettle with ice cubes !
Method … Take the Infra Red Thermometer outside,
- point it at ground, take the surface temperature reading (jot it down),
- now point it straight up at the sky, take the temperature reading & note conditions (jot them down).
- Repeat in different conditions – clear sky, cloudy, overcast, misty, day & night.
- You will rapidly see a pattern; the atmosphere is always colder than the surface
- (Remember the second law – Heat always flows from hot to cold.)
- Therefore a cold atmosphere can’t be ‘cooking the earth’.
- .
- A clear night sky can give a difference of 50°C or more. ( CO2 is not blocking heat loss)
- A cloudy sky may only be 6°C different. ( as water vapour is blocking heat loss)
- Rain or Misty, only a few °C different. ( as water vapour is blocking heat loss)
Proving conclusively that water vapour is the main Greenhouse gas
& that CO2 is only a bit player.

For more info please goto – Greenhouse gas pages
Sept 2018
More disturbing News from the media –
BBC’s new official policy – ‘Don’t report any challenge to Global Warming (AGW) theory’.
So much for BBC impartiality !!
The explicit statement of this policy was set out in a four-page memo by Fran Unsworth, the BBC’s Director of News and Current Affairs. [ apparently Fran Unsworth is a real world authority on the proper reporting of science… due to her degree in… Drama: ]
She gets £340,000 to decide what your opinion should be and suppress or attack any other viewpoints.
[ Interestingly the spell-check on Unsworth gives… ‘unworthy’!!! ]
More details, including the full memo from –
Also reported in The Times – 8/9/20 – https://www.thetimes.co.uk/edition/news/bbc-freezes-out-climate-sceptics-fqhqmrfs6
The issue gets wider coverage: Here & here
♦ ♦ ♦ ♦ ♦
Sept 13/14 Hurricane Florence
The Myths & then… The Facts
“Climate change is real. Welcome to the new normal”… The Washington Post.
“Florence ‘the storm of a lifetime’ “…National Weather Service.
“Hurricane Florence, on track to become the first Category 4 storm to make a direct hit on North Carolina in six decades”… “bringing a storm surge as much as 13 feet (4 meters)” Reuters.
Some of the original predictions of how Florence was going to be one of the strongest storms ever to hit the Carolinas.
The Facts –
In the event, the hurricane began to weaken long before it reached the coast, where it made landfall September 14th as a Cat 1, with sustained wind speeds of 90 mph. & rapidly reduced to a tropical storm.
Max storm surge was around 6 feet (1.8 m).
There have only been eight major hurricanes which have hit the Carolinas at Cat 3 or over since 1880, including three Cat 4s – Hazel, Gracie and Hugo in 1954, 1959 and 1989 respectively:
The media at it’s best worst –
The Weather Channel typically sends a reporter to hurricane landfalls to file live reports. Hurricane Florence is no exception.
However, in this case although it appears in the video the reporter Mike Seidel can barely stand up in the wind, but when the camera zooms out, his fakery is revealed.
The wind is coming from right to left…& he’s braced for a left to right wind.
https://www.youtube.com/watch?v=lCDzfZtVR2U Actual wind speed (on left of screen = 29mph).
Here’s another example of how media tries to make the storm look worse than it actually was – CNN’s Anderson Cooper was reporting live on the scene on a flooded road.

Another Shallow flood https://youtu.be/zbjXJM8_qus
& another https://www.youtube.com/watch?v=cgm3_jzcNm4
All real…fake; with all the actual death & destruction around, why do they have to fake it ?
♦ ♦ ♦ ♦ ♦
Aug 2018
‘A World On Fire’
Lots of media cover on ‘Wildfires’ caused by ‘global warming’ ‘climate change’ & supported by this image from NASA’s Worldview, showing all the worlds fires on one day August 22, 2018.

The satellite image shows actively each burning fire, detected by thermal bands, shown as red points. Caption ‘A World On Fire’ : Lynn Jenner.
As you can see central Africa & Madagascar appears to be almost consumed by fire …
BUT… Lynn Jenner is being deceitful
View this data on NASA’s ‘Worldview’ – & it looks much less alarming. All of that red is made up of standard sized data points that shrink when you zoom in. The center of the ‘African firestorm’ has a small fire every 20km or so. (thanks to Anthony @ WUWT)
Is the world on fire? Obviously not! The headline is complete nonsense, but many people have been taken in, because…it comes from NASA.
The correct news is that fires are much less prevalent than they used to be. It’s mostly because of changes in land use. The news coverage would make you think fires have increased a lot when the opposite is true.
Some of the “fires” are industrial sources and gas flares, and incinerators — all thermal anomalies. NASA fails to mention this in their press release.
Everything in that picture is bogus. Everything. The Earth does not look like that, not even if you decided that it is a good idea to show microwave channel on the rgb channel ‘red’. The red (which has nice spinny connotations to hot and danger) pixels work as a mask to show where individual peaks are. Their coarseness heavily pollutes nearby regions to the extent they completely mislead the random watcher ( a bit like they use coarse grids to spread temperatures across the globe).
The pictures, and the headlines used with it, are, in essence, what fake news often consists of.
♦ ♦ ♦ ♦ ♦
July 2018
‘Wildfires’
We have been told for years by various global warming advocates that global warming was going to increase the number of wild fires. It was proven… because the models said so.

Figure 2. Wildfire occurrence (a) and corresponding area burnt (b) in the European Mediterranean region for the period 1980–2010. Source: San-Miguel-Ayanz et al. [37].
Most wildfires in the European Mediterranean region are caused by humans.
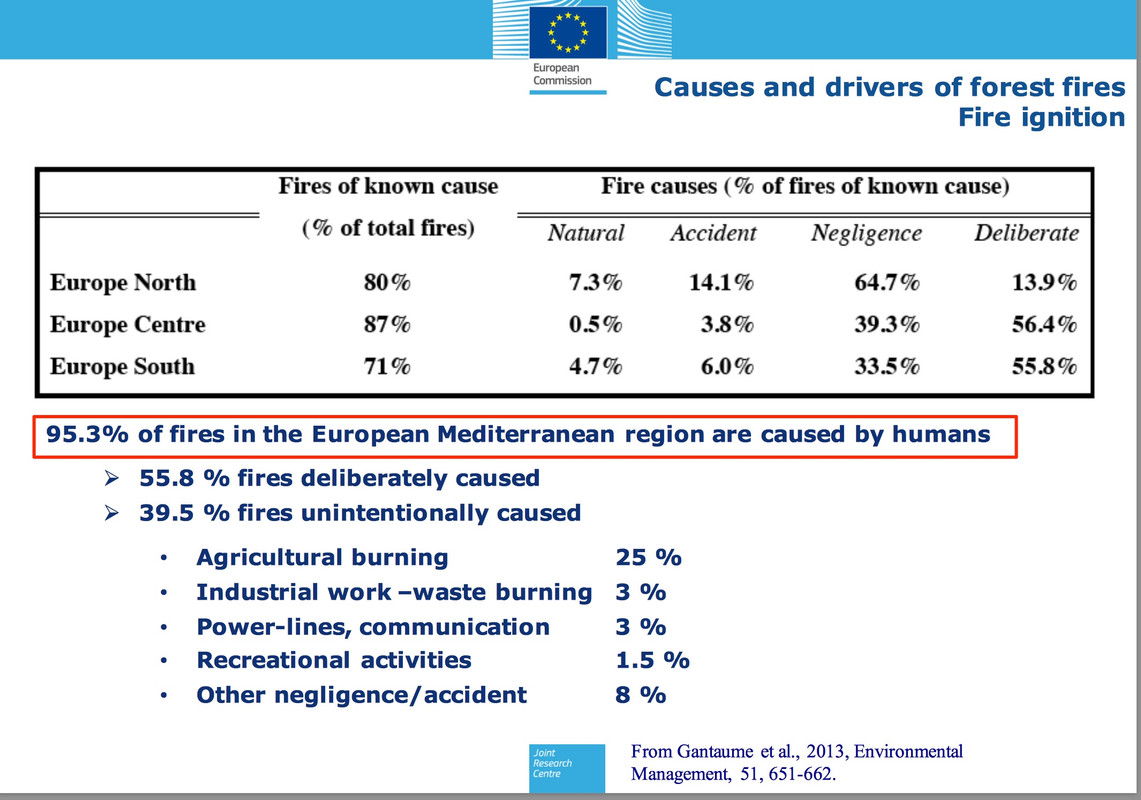
The Californian wildfires recently, again blamed CAGW, but the final reports sited electrical infrastructure – warnings were issued to the officials that subsequently blamed climate change!
“These fires are unprecedented. We’ve never seen anything like it. ”
— Governor Jerry Brown on “60 Minutes”. 10 December 2017.
US fire data says different ….

July 2018
Ice
We’ve had so many (“Arctic ice ‘is at tipping point’ ” BBC & ” Arctic warming: scientists alarmed by ‘crazy’ temperature rises” The Guardian ) scare stories so they must be true ….
BUT…
truth is stanger than fiction...this is the present state of Arctic ice concentration as documented by scientists at the Arctic Reserch Center St Petersburg (red & green is actual Arctic ice cover) (it’s updated weekly)

Shame when real scientific facts spoil a dramatic fake news story.
July 2018
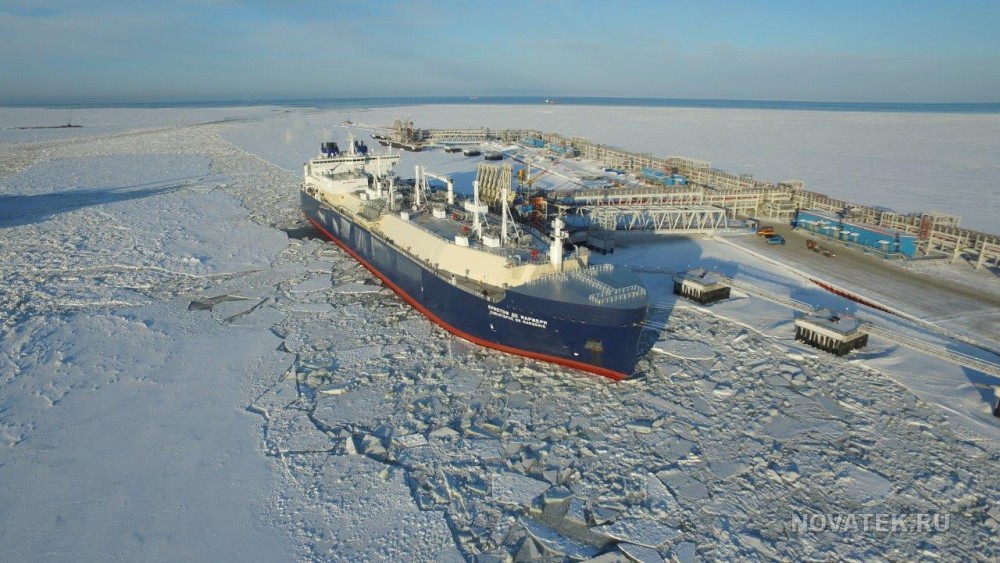 Ice Breaking LNG Tanker in 2m thick icet at the YAMAL Gas terminal, Sabetta, North Russia. Photo: NOVATEK
♦ ♦ ♦ ♦ ♦
June 2018
Tankers traped in ice. The global warming, which there has been so much talk about for such a long time, seems to have receded a little and we are returning to the standards of the 1980s and 1990s,» says company representative Andrey Smirnov.
&
This made me smile – Ironic CO2
We’ve cut anthropogenic CO2 production …..
so now we could all starve;… I think that maybe instead of drowning in the boiling acid oceans… !!!
♦ ♦ ♦ ♦ ♦
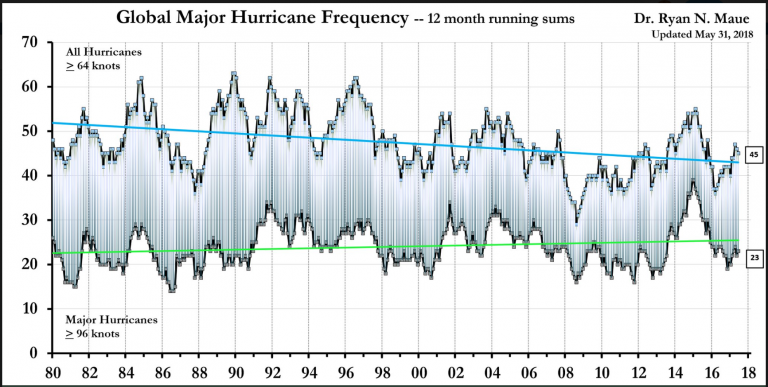
Remember the all the catastrophic claims of ‘more CO2 will bring more wild weather’ & all the snow & ice will melt
Over the past 4-decades, number of global HURRICANE strength tropical cyclones (about 48/year) have actually DECREASED.
♦ ♦ ♦ ♦ ♦
May 2018
Is Greenland melting away ?…NO
Greenland’s Snow & Ice accumulation is currently near average of last 36 years; here is the – Surface mass balance (gaining ~ 2 Gt/day) & Accumulated surface mass balance–
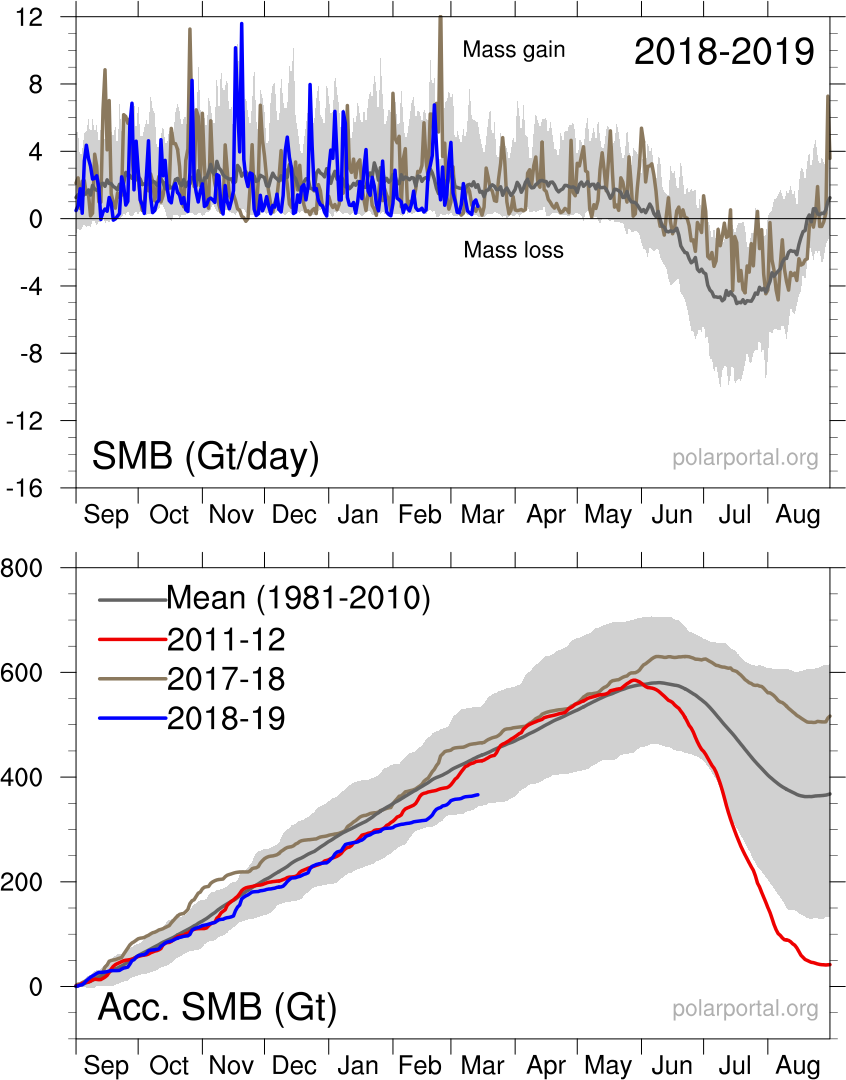
from – The Danish Arctic research institution & http://research.dmi.dk/research/research-topics/arctic/
http://www.dmi.dk/en/groenland/maalinger/greenland-ice-sheet-surface-mass-budget/ (Auto updates daily)
♦ ♦ ♦ ♦ ♦
June 2017
♦ ♦ ♦ ♦ ♦
As we’ve been told for many years, an increase in CO2 will produce more intense weather events such as tornadoes in USA; NOAA has just released the figures for 1970-2016.
This graph shows what has happened as CO2 has increased since 1970.

Data is fascinating stuff !
♦ ♦ ♦ ♦ ♦
June 20th 2017
Some more details of the modern warming.
♦ ♦ ♦ ♦ ♦
June 12th 2017
Yet another scientific research study that intended to study global warming has been cancelled… because of “unprecedented” thick summer ice. Naturally, the scientist in charge has blamed it on ‘climate change.’ They determined it was multi-year ice, chunks measured between five and eight metres thick.
http://www.cbc.ca/news/canada/manitoba/climate-change-study-1.4157216
♦ ♦ ♦ ♦ ♦
Since Al Gore used Michel Mann’s 1999 fraudulent historical hysterical temperature chart “the hockey stick graph” to promote his global warming / carbon trading business, there have been 100s of scientific teams looking at temperature sets from around the world.
Here are ~300 Scientific Papers (1997 – 2017) Challenging ‘Global’ Warming with data showing historical temperatures of land, sea, atmosphere & ice. [ follow links to see each paper ]
Thanks to Kenneth Richard & Pierre Gosslin for collating.
| Take care when reading & comparing graphs; some have zero on left others on right;
So what at first glance may look like a rise… maybe a falling trend. Some use actual date, some use ‘BCE’ “Before the common era” (or our year zero), others use ‘BP’ “years Before Present (& that means 1950). So to make sense, you may have to add…nothing, or 2017 yrs, or 67 yrs; Confusing or what ! Who said science was settled…they can’t even agree a common layout for the same data on a graph. |
But the data, however confusingly presented, still confirms what we all knew…our climate is just nature doing what it’s done for billions of years.
♦ ♦ ♦ ♦ ♦
May 22nd
Global warming is now “The Apocalypse.” And comes complete with 97% more fear factor.
Over the last 50ish years, we’ve seen great deal of re-packaging & re-branding from one side of the climate debate as they constantly re-market their ideas.
Forget about –
- ‘Ice Age Coming’; not cold enough.
- ‘Catastrophic Anthropogenic Global Warming’; seems it’s not terrifying enough, (or hot enough).
- ‘Weather Weirding’; but the data showed no such thing.
- ‘Climate Change’; not changing enough.
So after years of research (in the dictionary), they’ve managed to both cut the packaging by 50% & add 97% more fear factor –
The new brand-name of Global Warming is now “The Apocalypse.”
Short, Snappy, Scary, Backed up by 100s of Hollywood ‘B Movies’, Sounds Biblical….what’s not to like.
More detailed explanation here.
♦ ♦ ♦ ♦ ♦
May 20th
Another example of why we can’t trust academic peer review any more –
A hoax paper consisting of random garbage, some of it computer generated can ‘pass peer review’ & be published in an academic journal (Cogent Social Sciences ) therefore gaining credibility, as long as it contains certain key words.
This is just one example from many. Full story here.
♦ ♦ ♦ ♦ ♦
May 15th
While climate alarmists will tell you the “science is settled,” in reality, it is anything but. One of the more interesting theories is “Cosmic Ray Theory.” where cosmic rays hitting Earth’s atmosphere create aerosols which, in turn, seed clouds and thereby help in the formation of clouds. This would make cosmic rays an important player in weather and climate
This theory is currently being put to the test, as the sun has become unusually quiet.
Read More: COSMIC RAYS ON THE RISE AS SOLAR MINIMUM APPROACHES
♦ ♦ ♦ ♦ ♦
April 2017
April 22nd – Sea ice off Newfoundland thickest ever & yet another polar bear comes ashore
♦ ♦ ♦ ♦ ♦
April 13th – Two articles on temperatures –
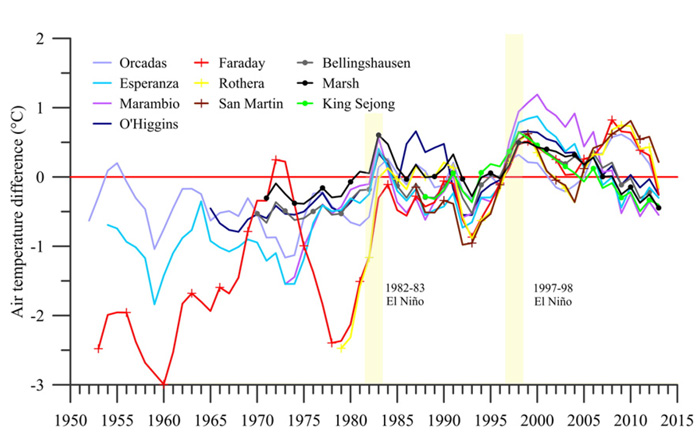
1. The Antarctic Peninsula has widely been reported as one of the fastest warming places on Earth, (which it was for 5 yrs 1993-1998) and therefore evidence of CO2 induced global warming;
But scientists have confirmed that the region has actually cooled between 0.5 to 0.9 °C since 2000 despite increased CO2 levels.
http://www.co2science.org/articles/V20/apr/a17.php
http://www.co2science.org/articles/V20/apr/Olivaetal2017b.jpg
More on that Antarctic Peninsula story & discussion.
2. Several papers confirming rapid temperature rise ~ 30 times faster than present, (14,700 yrs ago when CO2 was almost half what it is to day). Plus 25 other warming/cooling events.
“during the last 100 to 150 years there has been a dramatic rise in anthropogenic CO2 emissions and atmospheric CO2 concentrations…but no accompanying dramatic rise in temperatures or sea level.
Thus, the theory that human activity or CO2 concentration changes are the primary drivers of temperature changes and sea level rise, does not seem to be supported by the geological evidence.”
♦ ♦ ♦ ♦ ♦
March 2017
Stunning 3D imaging of Antarctica from European Space Agency’s CryoSat satellite shows the land extent plus permanent ice shelves but all sea ice digitally removed.

♦ ♦ ♦ ♦ ♦
Yet more Fake Climate Nonsense in the media –
“Deadly heat stress could threaten hundreds of millions”
All because of a ‘projected 2ºC temperature rise’,
Yes, & I COULD win the lottery tomorrow !
(Note all the: is projected, could be, if, suggest, words.) More on it here.
By the way; 2ºC is the ~ difference in temperature between your feet & head levels in still air; & you are 17 times more lightly to die of excessive cold.
♦ ♦ ♦ ♦ ♦
More fake news from the BBC – this time about Miami Beach turning into ‘Modern Day Atlantis’
On The World at One at 28:40.
BBC reporter Nick Bryant said – “sea levels at Miami are rising at ten times the global rate”.
BUT
According to NOAA the global rate is ~ 3.2mm/yr
& Miami Beach is 2.39mm/yr
Not 10x global rate but – just 75% of global rate.
So who should we believe… Science or …the BBC (who inflate the figures x13 to make a story). More info here.
There’s a lot more to Miami than vice & sea level rise…start with geography & geology (it’s a sandbank & swampland on top of porous limestone), plus 100 years of massive water abstraction & some really bad civil engineering.
| Maybe they had the answer 2,000yrs ago –
Matthew 7:24-27. “And they shall be likened unto a foolish man, which built his house upon the sand: |
Excellent article about Recent Sea-Level Change at Major Cities
♦ ♦ ♦ ♦ ♦
‘Man-made global warming’ proved again … by BBC
Red shows areas of ‘record heat’**

**BUT: The Red areas of ‘record heat’ are in places where NOAA say (on bottom left of their maps) – “Please note: Gray areas represent missing data”
This is why it is called ‘man-made global warming’.
When they have no data… they just invent it.
It certainly is “extreme and unusual”, because it has not actually happened.
Another example of fake news, ( in banking its called fraud ).
Thanks to Paul at https://notalotofpeopleknowthat.wordpress.com/2017/03/23/fake-news-bbc-claim-of-record-temperatures/
♦ ♦ ♦ ♦ ♦
March 20. – Massive coral reef die-off
But – Not global warming. Not ocean acidification – it’s Crap…our Crap.
‘Dead Zones’ on coral reefs caused by sewage and agricultural runoff say researchers at Smithsonian Tropical Research Institute,
“… they suspected it was caused by a dead zone–a low-oxygen area that snuffs out marine life–rather than by ocean warming or acidification…”
“For every one dead zone in the tropics, there are probably another nine of which have yet to be identified.”
“The team thinks that such dead zones may be common in the tropics but have gone largely unreported, simply because scientists never looked…”
The researchers found 20 instances when dead zones were implicated in the mass mortality of coral reefs worldwide. “Hypoxia (low oxygen) isn’t even mentioned in several of the most important academic reviews of threats to coral reefs and is rarely discussed at scientific meetings,”
The Smithsonian full media release.
&
another coral reef story on same day – Local divers on The Great Barrier Reef say less than 5% is damaged, they dive on it daily so should know…instead of relying on computer models.
♦ ♦ ♦ ♦ ♦
Another false ‘sea-level rise’ panic headline –
“Louisiana wetlands struggling with sea-level rise four times the global average”…“more than 60 percent of sites are on track to drown,” !!
But, they are measuring APPARENT sea level, not actual; the whole area is subsiding so yes the area will drown. (“they were able to calculate how rapidly sea level is rising with respect to the coastal wetland surface”)
Many reasons for subsidence in that area…including – oil & water extraction, levees that starve the wetlands of silt & fresh water, geological fault lines, storm damage.
♦ ♦ ♦ ♦ ♦
Here is another example of “consensus” science at work –
35 yrs as a Pariah. Prevailing archeological thought was that humans crossed from Siberia to Alaska and the Americas over a land bridge approximately 13,000 years ago ( they became known as the Clovis people).
In the 1970s a French-Canadian archeologist Jacques Cinq-Mars and his team found evidence of human activities much earlier & between 1979 and 2001, he published a number of papers arguing for his original theory, this went against the consensus so he was viewed as a pariah in the archaeological community for ~ 35yrs.
In Jan 2017 another archaeological team in Oxford confirmed that people were in the area ~24,000 yrs ago; now, the ‘Clovis people theory’ has been set aside vindicating Cinq-Mars after 35 yrs.
Full paper – http://journals.plos.org/plosone/article?id=10.1371/journal.pone.0169486
♦ ♦ ♦ ♦ ♦
Caught in the act.
♦ ♦ ♦ ♦ ♦
Sad to report that a once fine organization (of which I was an early member in the 70s) has sunk to the level of snake-oil salesmen.
Greenpeace admits in court that it lies & distorts the truth about climate…as a marketing strategy.
Greenpeace also distorts the truth about its own history; …some of its founding members – Ben Metcalfe, first chairman of the Greenpeace Foundation in 1970 & Dr Patrick Moore have been erased from the recent lists of Greenpeace founders after they criticised the way the group had become anarchists. Here’s Dr Patrick Moore speaking in 2015
♦ ♦ ♦ ♦ ♦
March 6, 2017 Flashy First Images Arrive from GOES-16 Lightning Mapper. The first lightning detector in a geostationary orbit, the Geostationary Lightning Mapper (GLM), is transmitting data never before available to forecasters.
♦ ♦ ♦ ♦ ♦
For years we have been told by ‘ex-sperts’ that “snow will be a thing of the past, children won’t know what snow is!”
Snow & Ice (Northern Hemisphere) to date –
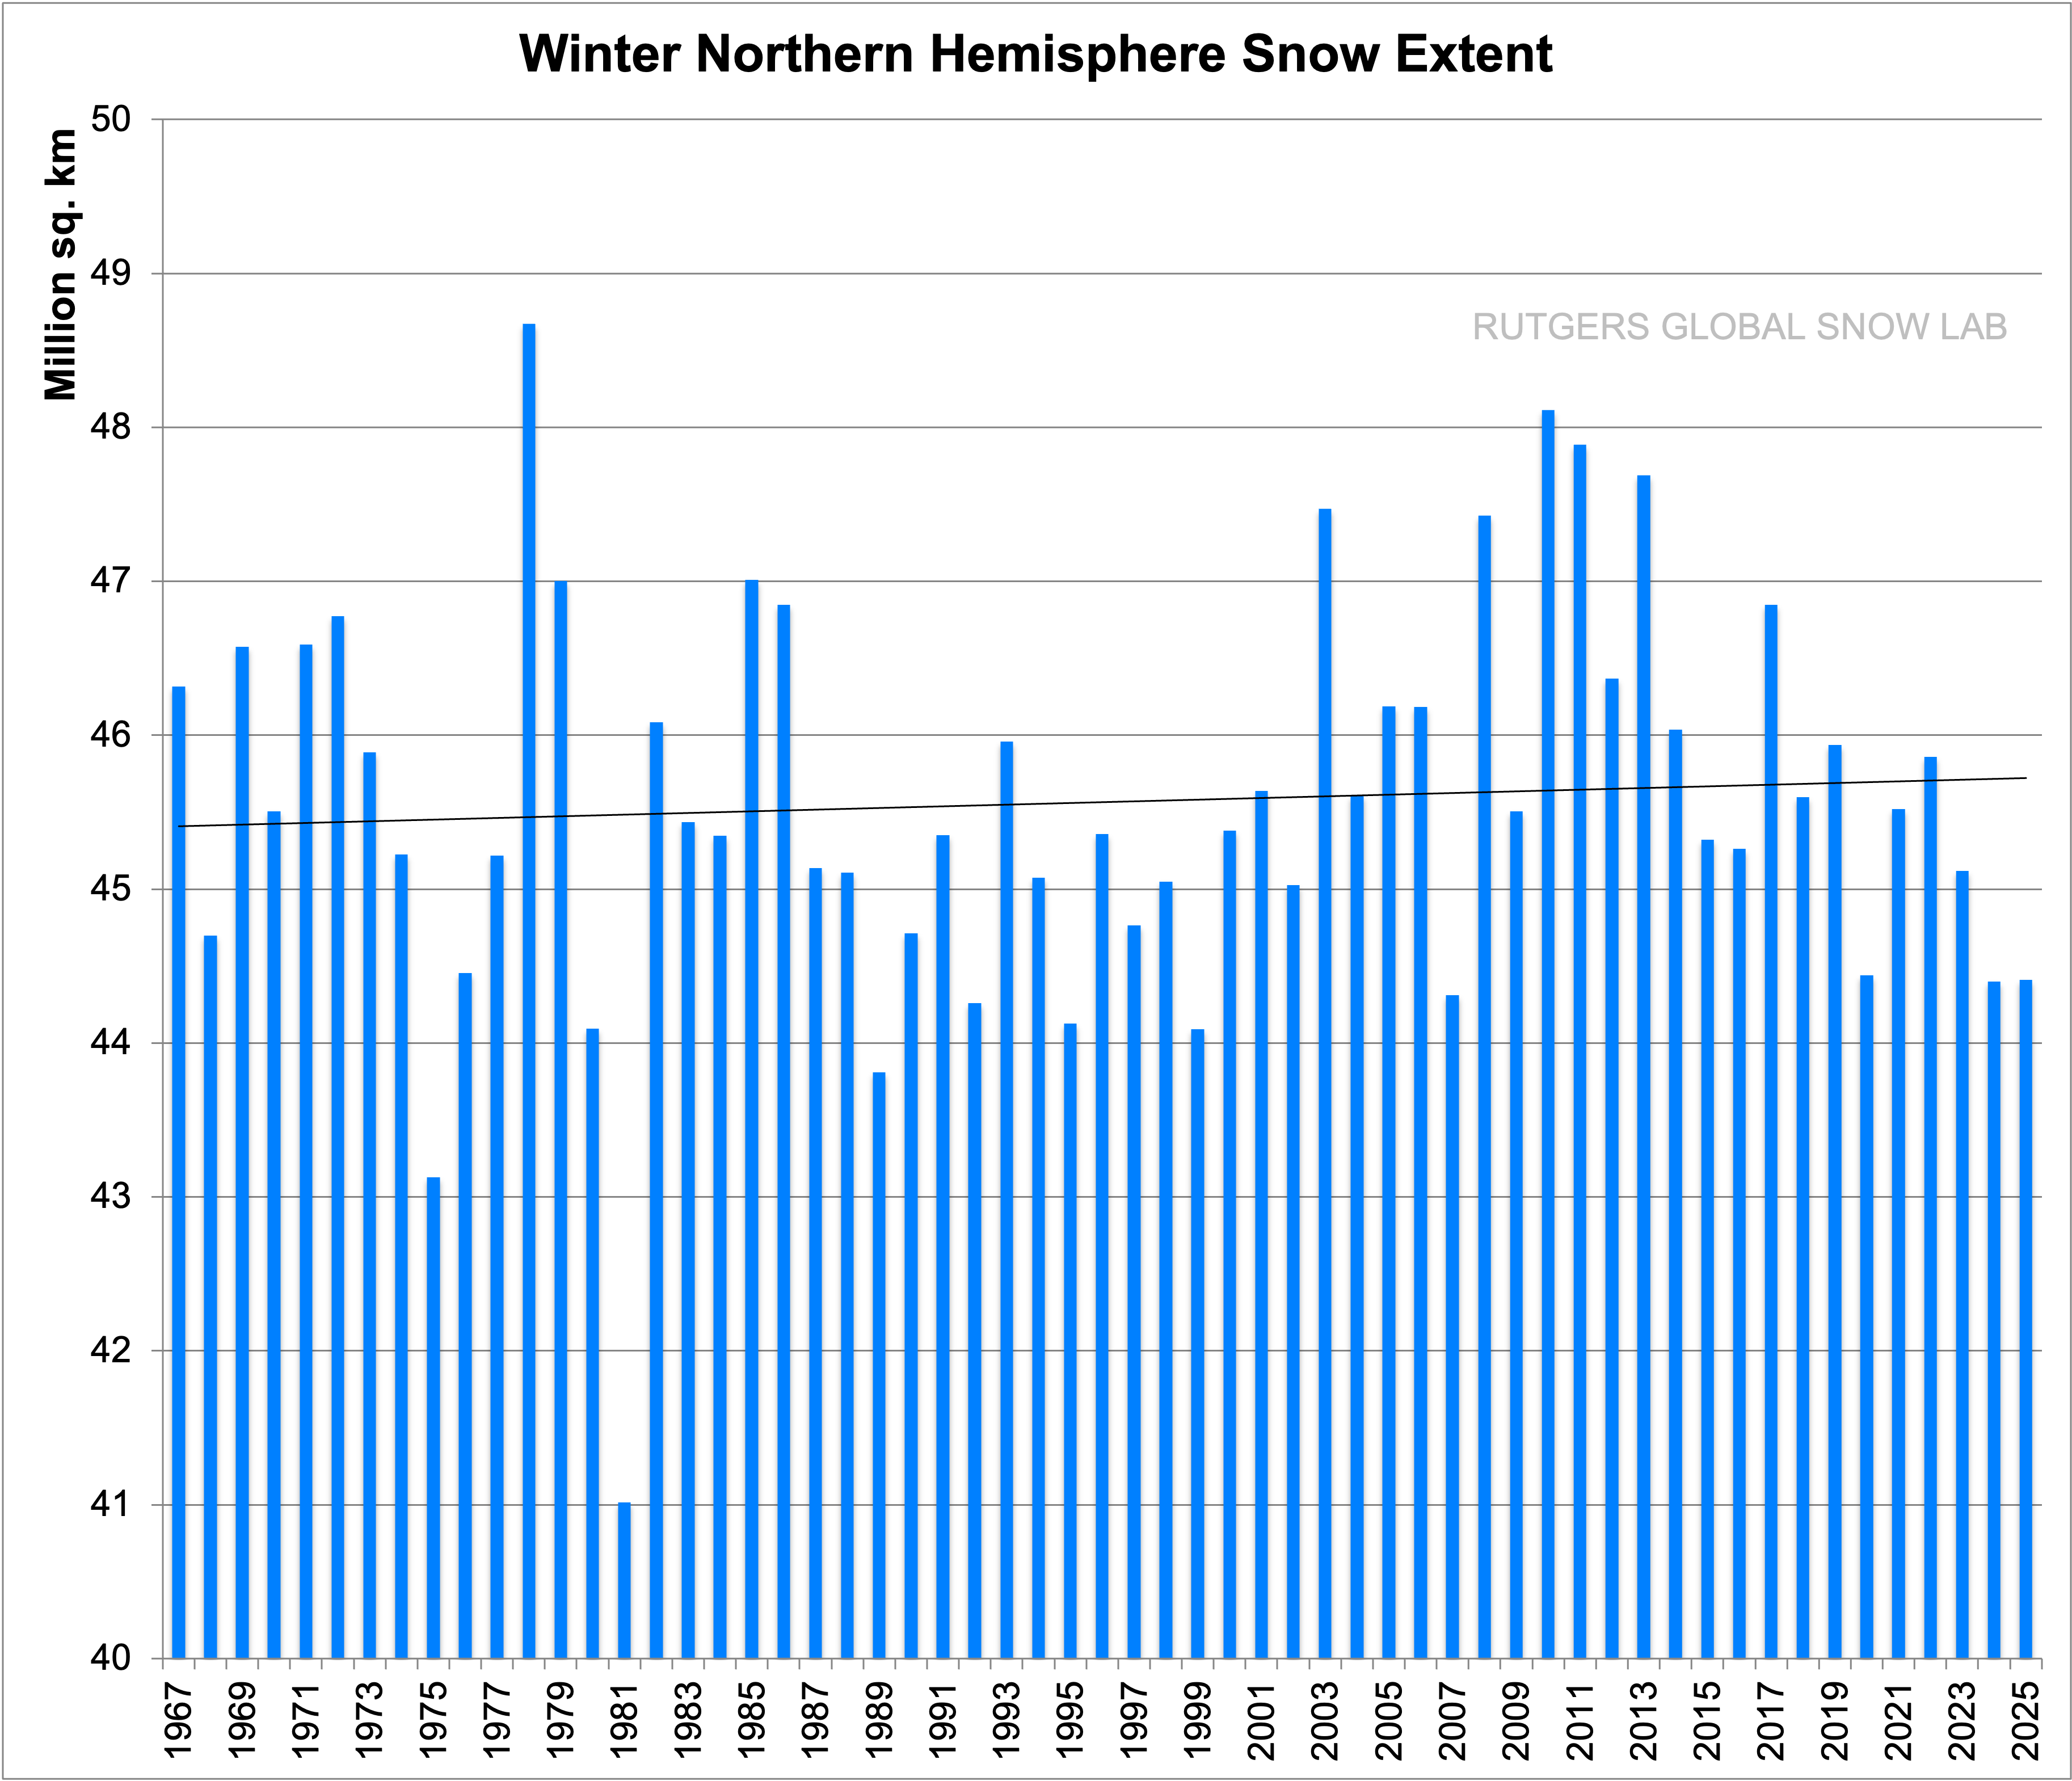
Snow & Ice cover (Northern Hemisphere) (updates daily)

But its not only the snow depth. Also the Snow-Extent is higher than 2016: From NOAA


♦ ♦ ♦ ♦ ♦
February 2017
24 February 2017
CO2 – Yet another Carbon cycle paper showing mans contribution to CO2 levels is just a tiny 4.3 % compared to natural sources; with an atmospheric lifetime of ~4 yrs (not the “few hundred thousand years” often claimed).

So despite all the crazy political claims… nothings changed in 24 years.
♦ ♦ ♦ ♦ ♦
2016-17 Increase in Greenland Snow & Ice accumulation is ~3 billion tons/day

from – http://www.dmi.dk/en/groenland/maalinger/greenland-ice-sheet-surface-mass-budget/
♦ ♦ ♦ ♦ ♦
When will Spring 2017 be Sprung ?
~ 13 March …just over three weeks later than it was last year.
Interesting Met Office data set & explanation from xmetman.
Shows earliest dates as 13th Feb 1989 & 14th Feb 1916:
& latest as 10th May 1784 & 9th May 1795 (both in the Little Ice Age).
♦ ♦ ♦ ♦ ♦
18/2/17 – Arctic cooling again…now has ~ 14.3 million sqkm of sea ice with another 3 weeks to go to start of melt. Nice clear area chart from xmetman, & the Arctic temperature chart from Danish Meteorological Institute
♦ ♦ ♦ ♦ ♦
Tuesday, February 14, 2017 Antarctic ice has increased compared t0 last few years.
“We experienced a significantly larger ice field this year (2017) compared to the last several years,” said Capt. Michael Davanzo, commanding officer of the Polar Star.
The crew of the Coast Guard Cutter Polar Star arrived at the National Science Foundation’s McMurdo Station Tuesday after cutting a re-supply channel through more than 60 miles of Antarctic ice in the Ross Sea.
In the past few years, the Polar Star’s crew worked through approximately 12 to 13 miles of ice in an effort to reach McMurdo Station. This year, there was more than 60 miles of ice to break, with thickness ranging from two feet to more than 10 feet.
http://www.marinelink.com/news/antarctica-arrives420957
♦ ♦ ♦ ♦ ♦
Study shows China’s severe weather has decreased significantly since 1960
In one of the most comprehensive studies on trends in local severe weather patterns to date, an international team of researchers found that the frequency of hail storms, thunderstorms and high wind events has decreased by nearly 50 percent on average throughout China since 1960.
Read more at: https://phys.org/news/2017-02-china-severe-weather-patterns-drastically.html#jCp
♦ ♦ ♦ ♦ ♦
111 year record shows No acceleration in sea-level rise (blue) it’s just 1.4mm/yr. while CO2 (green) continues a steady rise, indicating NO correlation between them.

For active data & more detail, Go to – http://sealevel.info/MSL_graph.php?id=1612340&boxcar=1&boxwidth=2&thick
♦ ♦ ♦ ♦ ♦
Major rate of INCREASE in Greenland Ice above previous years.
http://beta.dmi.dk/en/groenland/maalinger/greenland-ice-sheet-surface-mass-budget
(Visually current ice is about 500 Gt vs typical 400 GT or about 20% increase)
♦ ♦ ♦ ♦ ♦
NOAA Caught fiddling the figures…yet again
Now there’s a ‘Storm in science approaching
“America’s National Oceanic and Atmospheric Administration (NOAA) the world’s leading source of climate data rushed to publish a landmark paper that exaggerated global warming and was timed to influence the historic Paris Agreement on climate change.”
To summarize… NOAA –
- “breached its own rules on scientific integrity”
- “based on misleading, ‘unverified’ data”
- “never subjected to NOAA’s rigorous internal evaluation process”
- “maximised warming”
- “minimised documentation”
- “standards were flagrantly ignored”
- “tried to combine two previously separate sets of records”
- “violated NOAA rules”
- “computer used to process the software had suffered a complete failure”
- “NOAA not only failed, but it effectively mounted a cover-up”
- “rushed to publication in an effort to support the President’s climate change agenda”
Hopefully this time there will be consequences for this type of scientific malfeasance and criminal activity (e.g. unauthorized destruction of government property). Thanks to Boulder Skeptic
Read more:
- Booker On The NOAA Scandal
- http://www.dailymail.co.uk/sciencetech/article-4192182/World-leaders-duped-manipulated-global-warming-data.html#ixzz4Xo5xvUuP
- Exposed: How world leaders were duped into investing billions over manipulated global warming data
If this is true (which seems very lightly), it brings the whole of science into disrepute. We must remove politics & politicians pet agendas from science. We know we can’t trust politicians…. but we should be able to trust science.
♦ ♦ ♦ ♦ ♦
January 2017
Media have constantly been telling us how hot the world is getting, so when the 2016 results started coming out they were quick to tell us that Arctic ice is melting & publicise that Global Surface Temperature for 2016 maybe 0.07°C ±0.10°C warmer than 2015. [Note: Margin of error is greater than the amount measured ] ( the UK Met Office use a short term forecast tolerance of ± 2°C.)
| 2°C is the ~ difference in temperature between your feet & chest in still air. |
But then –
NOAA spoils it all by saying 2012 was the hottest & 2 Russian Ice-breakers get stuck in….sea ice up to 2.5m thick.
& nature kind of disagreed as well….this is how the Northern Hemisphere looked on Jan 21st 2017.
Blue = below 0°C; White = below –10°C; Pink = below –30°C:
Yet the media ignore or play down the numerous record cold and snow events occurring in many places around the world. Why ???
So for balance, here are a few examples you probably haven’t seen:
- Spain – Heaviest snowfall in 35 years
- New Mexico – Healthy snowpack in mountains
- Snowiest month on record – already – in Gunnison, Colorado
- Several roofs collapse in Oregon under heavy snowload– Too much snow
- California ski area headed for snowiest January on record
- Lowest temps in Moscow in 120 years – Video
- Bangladesh – Cold wave paralyzes life across country
- Snow over the top of your head in Russia
- India – Shimla struggling with record snowfall
- Emergency declared in Serbia due to sub-zero temperatures and snowdrifts
-
Cold Weather Alert throughout Bulgaria -11°C
- Coldest winter on record in Hillsboro, Oregon – 2nd coldest on record in Portland
- Freezing from Sicily to Siberia
- Pakistan, Record snowfall forces migration
- 4 meter thick Ice on River Danube
- Ski World Cup race cancelled – Too much snow
- Heavy snowfall traps 1,000 motorists in Tunisia
- Snow in New Zealand summer
many more here: https://www.iceagenow.info/
While the media worried about anthropogenic global warming scenarios, some good news in 2016 was likely missed: record crop yields and relatively fewer storms.
Global crop yields hit record levels, according to United Nations data. Production of wheat, coarse grains and rice are forecasted to be 1.7 percent, or 44 million metric tons, higher than 2015.
U.S. corn and soybean yields hit record levels in 2016, according to U.S. government data. Corn production rose 15.1 billion bushels, or 11 percent, from 2015, and soybean production rose another 4.31 billion bushels, or 10 percent, over the previous year. (The full Crop Production 2016 Summary is available online at www.nass.usda.gov/Publications.)
Fewer major tropical cyclones made landfall in 2016 compared to 2015. In fact, tropical cyclone numbers for 2016 were below the 40-year average.
According to NOAA, Tornadoes in 2016 were 50% of those in 2008. 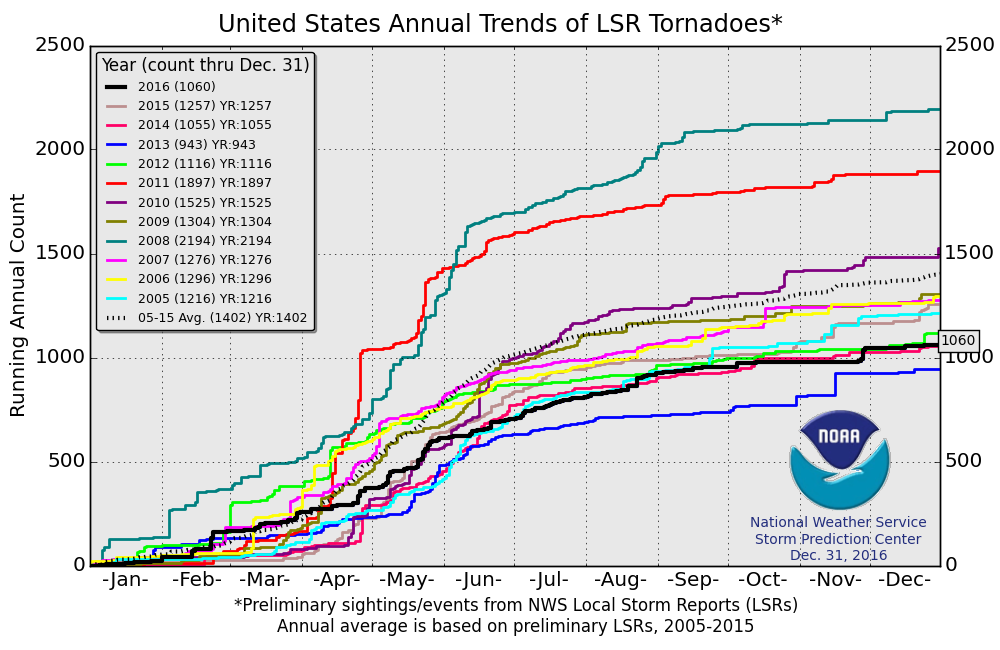
Do you remember the California drought panic 2016 –
Look what happened in 12 mths Weather.